
As a business owner, you can gain access to a staggering amount of information regarding your company’s performance and other metrics. However, being buried in data for the sake of having data is not helpful. An excess of facts, figures, and flow charts can often overwhelm even the sturdiest businessperson.
Even when you have a goal you are working towards, you will want the appropriate information to measure your progress and prove your results. This is where Google Analytics comes into the picture.
What is Google Analytics?
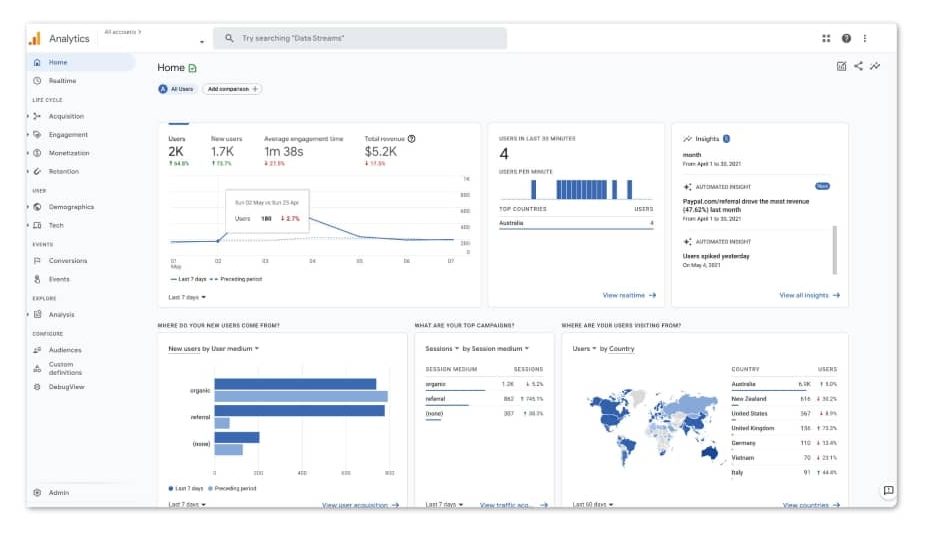
Google Analytics is a free tool that tracks activity on your website. The platform sorts and sends data regarding how site visitors interact with your web page. Google Analytics aims to provide you with easy to understand information that helps you determine what is working on your website and what you may want to adjust. You receive the information in interactive reports that are easy to read. In simplest terms, Google Analytics offers you insider, back-end and real-time data that lets you know what your users want.
Before Google Analytics, those wanting a deeper look into what happens on their website would need to read a server log. While this gave a significant amount of information, a server log was often challenging to understand.
Companies then began to collect information on log files. These were easier to understand, and the data was not in one big clump. In 2005, Google acquired a company that specialised in making log files and has improved upon the notion of making easy to understand reports ever since.
Users of Google Analytics benefit from the fact that it works seamlessly with other Google platforms for marketing like Google’s Search Console and Google Ads.
The evolution of Google Analytics
- The very early version of Google Analytics looked similar to the version used today. A primary difference is that the original version had less information than the versions that would come later. The reason for this is simple. Google collected a limited amount of user data at that time.
- By 2014, Google’s Universal Analytics was out in beta. The platform became essential for online businesses soon after its release. The rise of mobile devices made it necessary to track users across devices.
- October 2020 saw Google roll out their Google Analytics 4 (GA4). This version depends a great deal on machine learning and works to enhance predictive analysis. Additionally, GA4 directs the flow of all data into a single stream.
Why should I use Google Analytics?
There are several reasons Google Analytics is a smart choice for your business.
- Google Analytics is the most effective tool that you can use to track your website metrics.
- Compatibility with other platforms and tools
- You gain access to valuable data on your website visitors, including age, interests, location, and gender
- Understand the actions of site visitors, including why they bounce from your site
- Google, the behemoth of search, offers this tool. If you want information regarding your website, Google is the place where you can find it.
- You can customise your reports
- Google Analytics is free*
*Small and medium-sized businesses find all the data they need from the free version. There is a professional version available called Analytics 360. This paid version benefits large enterprises the most. It offers a dedicated account manager, unlimited and unsampled data, more data views, advanced funnel reporting, and more. The price for Analytics 360 begins at $150,000 a year and goes up after your website gets more than one billion monthly hits.
How do I use Google Analytics?
Starting your Google Analytics account takes a few steps.
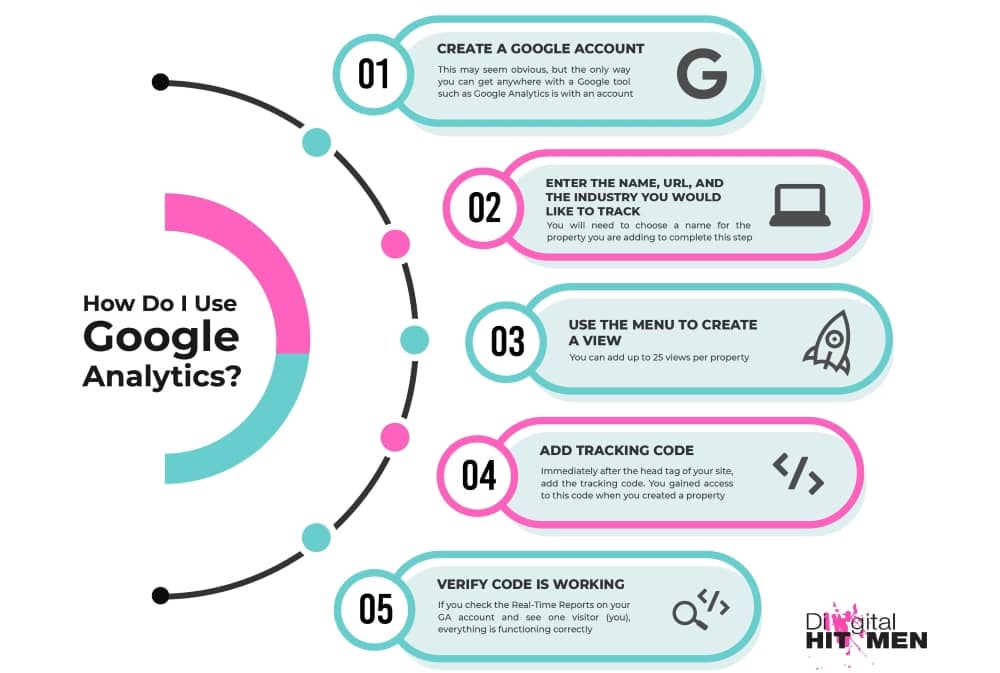
- Create a Google account – This may seem obvious, but the only way you can get anywhere with a Google tool such as Google Analytics is with an account.
- Enter the name, URL, and the industry you would like to track – You will need to choose a name for the property you are adding to complete this step.
- Use the menu to create a view – You can add up to 25 views per property.
- Immediately after the head tag of your site, add the tracking code – You gained access to this code when you created a property.
- Go to your Google Analytics portal and check to see if the code is working – If you check the Real-Time Reports and see one visitor (you), everything is functioning correctly.
Types of reports
You will find several report options to make it easier to focus on the data that will help you the most. These offer more specialised sub-topics within the report categories.
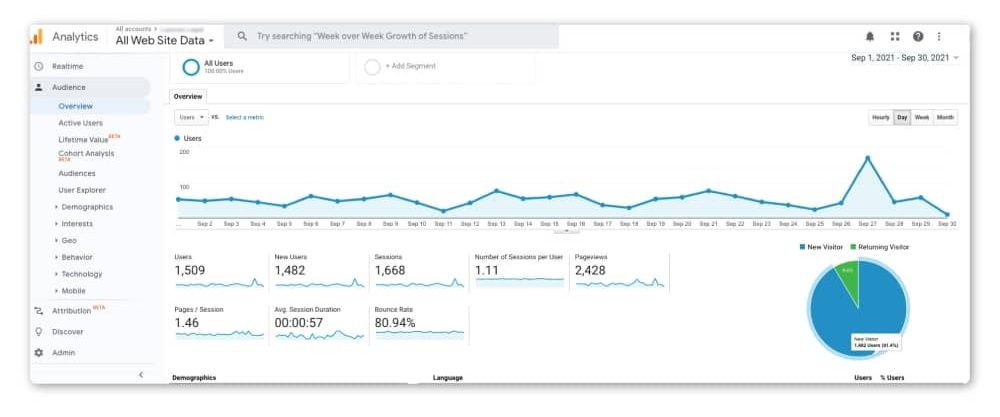
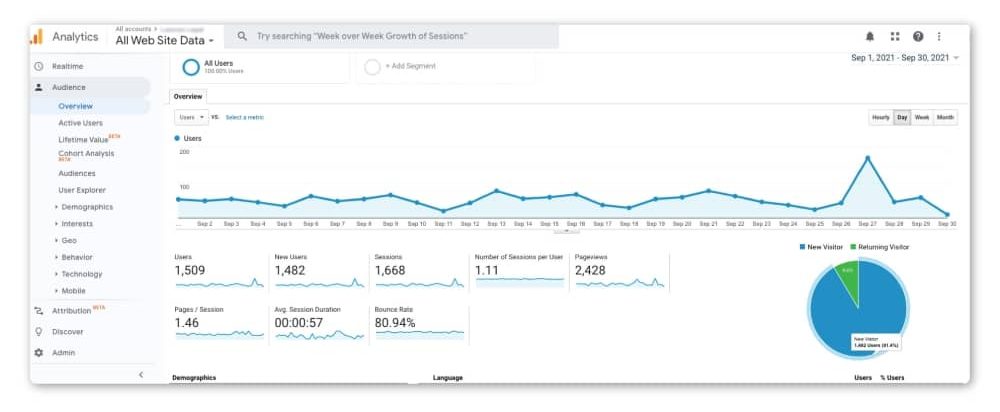
Real-Time – As the name suggests, this data comes at you as it occurs. Using Real-Time Reports, you can see the number of visitors on your website, where they are coming from, what they are viewing, and any conversions that take place.
Even though this information is interesting, the other reports offer you valuable data you can use.
Audience – The audience report provides beneficial details to help you understand those visiting your website. The dropdown menu gives you several sections that focus on specific audiences.
Acquisition – Viewing the acquisition report allows you to see a breakdown of your traffic based on the source. You can quickly see where the bulk of your traffic originates.
- Affiliate
- Direct
- Display
- Organic
- Paid search
- Referral
- Social
- Other- Google Analytics uses the term ‘other’ when it cannot categorise a traffic subset
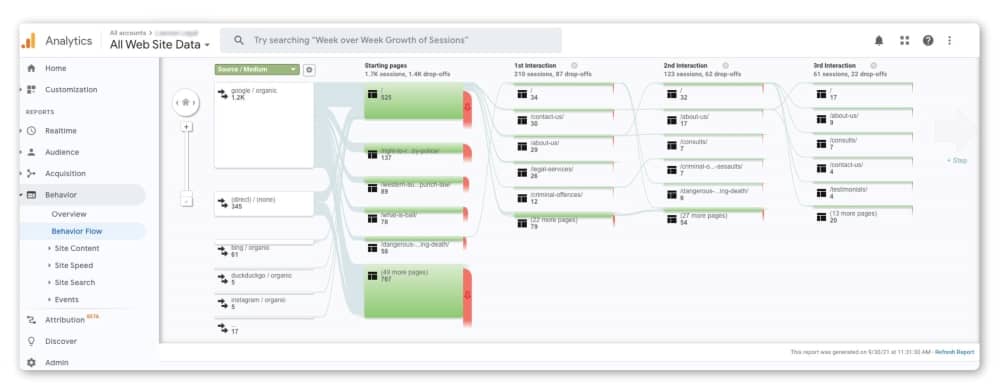
Behaviour – The Google Analytics Behaviour Report gives you data on all of your website’s landing pages, blog posts, and web pages. These are just the beginning of data available from a Behaviour Report.
Conversions – Using the Conversion Report, you can define what constitutes a successful conversion based on your goals.
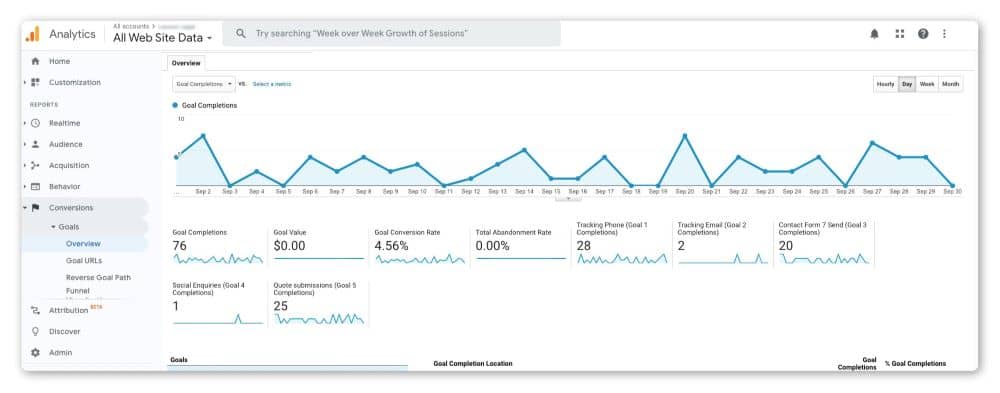
For example, if you are a B2B, you might define a conversion as booking a call with a rep or downloading an eBook. However, a media company may have a set amount of time or number of pages visitors set as conversions. An online retailer will have another benchmark for conversion. Usually, this is making a purchase
Helpful guide
The sheer amount of information you can get from Google Analytics Reports can feel almost overwhelming. To get the data that will help your company thrive, consider turning your attention to the information found in the following,
- Identify and optimise the pages getting the most attention – Once you see what you are doing well, you can focus on doing it magnificently. Take a hard look at the pages that are top performers. Then decide, can you fine-tune your meta descriptions, optimise for more effective keywords, or otherwise enhance the pages to improve search engine understanding and user experience? If so, do it.
- Track the best traffic sources – You can monitor your ad campaigns to see the most impactful and how your visitors interact with the ads. Additionally, learn whether you get more paid or organic traffic so your ROI is as good as possible.
- Adjust the attribution model to fit your strategy – The default setting for the attribution model is the “Last Interaction”, but it may not be your best choice. For example, seeing the first interaction will show you how individual channels impact your conversion rate. There are many attribution model options available.
- Learn which content is most valuable – Sometimes, even content that you are positive your visitors will love falls flat. Using Google Analytics to see how content impacts your site visitors and how they interact with the content sheds light on what direction you should move. Learning what your customer likes always gives you a chance for growth.
- Trend analysis – The virtual marketplace is constantly evolving. This can make keeping up with what people want difficult, to say the least. You can learn if something is a passing idea or a permanent fixture by analysing what is trending.
Analytics terms
Although many of the terms used as a part of Google Analytics may be familiar to you, here is a glossary of some key terms and phrases to help you work with Google Analytics.
- Data Set in Google Analytics – A data set in Google Analytics is what holds the information you upload to GA. Data sets manage how newly uploaded data connects with existing data
- Dimension in Google Analytics – In GA, a dimension is a quality of a data set that you can organise for better analysis
- Goals in Google Analytics – There are four kinds of goals in GA that help you improve your website:
- Destination Goals – Will track when a visitor lands on a specified page
- Duration Goals – Track your user’s engagement on your website
- Event Goals – Help you track actions that Google would not track by default
- Pages Per Visit – GA will keep track of how many pages of data are read each time your site has a visitor
- Google Analytics SDK – The GA Software Development Kit helps you add metrics for mobile apps on iOS and Google’s Android platforms right from the beginning of your app process.
- Google Analytics Tracking Code – The GA tracking code allows you to collect the user’s browser /system information, first-party cookies, and HTTP request from the user
- Google Analytics Tracking ID – A tracking ID for GA is a code string that tells GA where to send the information collected
- Landing Page in Google Analytics – The landing page is the first page your user sees when entering your website
- Metric in Google Analytics – A metric in GA is a unit of data that explains how a specific segment of your business performed during a particular time frame
- Referral in Google Analytics – The referral in GA is the way Google tells you about visits to your website initiated from outside of its search engine
- Remarketing in Google Analytics – In GA, remarketing is when Google sends targeted ads to those who visited your site but did not convert
Start using Google Analytics for your business
As you can see, Google Analytics is a treasure trove full of information that can help you grow your business to levels you may have never thought possible. At the same time, proper use of the data is an essential part of this growth.
If you lack the time or the personnel to devote to working with Google Analytics, consider working with the professionals here at Digital Hitmen. Contact us to learn how we can help your company reach new heights.